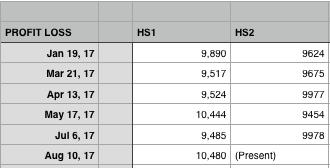
Below is a snippet of the 2017 results with time slices to see relative draw downs across all three trades.
The RED defines when we’d have exited for the trade but sometimes I tracked what if we hadn’t. I don’t even see a drawdown for the HS1 in 2017 (short of the -209 on the Jan 19th trade).
I will be testing the HS1 in random entries as well to see how the DIT changes and how bad draw-downs can get.


I’ve been following along with everything via Slack and the forum. This is very promising stuff! Looking forward to your presentation this week!
At this point, I have no idea how to add value 🙂 But I’ll show my backtests and talk about high vol entries.