I’ve been backtesting 3 variants side by side from 2014-2017 w/ entry during a SPX down day of at least 0.5% and a corresponding VIX spike. The High vol entry makes the management of the trade much easier, the more the spike and down, the easier it is to manage. I’ve been testing the HS1, HS2 and the new fulcrum trade . I am not done yet but it’s close. I will be presenting at a mastermind next week and will be talking about the trades and its results.
So far I’ve not had a loser for the HS1 variant which I manage in a specific way. The drawdown has been less than 400 a unit as well. Very very good. The average days in trade is about 48 so far and the return is about 12.5%. The more higher VOL entries will sometimes get to profit in 8-14 DIT especially in more bearish conditions. Beautiful trade.
Here’s what it looks like at initiation:
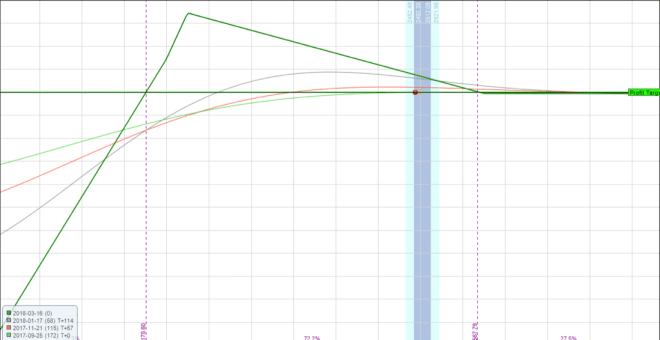
Despite what it looks like to the left, in a black swan event, it will pick up and handle it just fine if not at a profit.
Here’s a few of the trade initiated around Aug 24 crash date:
Aug 20, 2015 ENTRY

Aug 21

Aug 24 Crash day

Despite the left side, it does pick up and reach profit target on the 21st AND almost double the profit target on the 24th.
The market moved from 2035 to 1890 and it did just fine.
The same goes for the Jan 2016 slow bear move down. It just crushes.


